AI Is Changing Software Development. Observability Needs to Keep Up.
AI is becoming part of both how we build software and what we build into it. Coding agents are increasingly involved in development workflows, while applications are incorporating LLMs, AI agents, tool calling and multi-step automation.
But there's an important question: How do we debug and understand the systems we're building with AI?
A single AI-powered request might involve multiple model calls, tool executions, database queries and external services. When something goes wrong, looking at a single error log or API response often isn't enough. We need to understand the entire execution path.
I've been exploring this through Sentry, integrating distributed tracing into my Next.js project, LearnAI.
What interested me was how Sentry brings together application observability, distributed tracing and AI-assisted debugging and how relevant that combination is becoming.
1. Getting started with Sentry
I integrated Sentry into LearnAI using its Next.js SDK:
npx @sentry/wizard@latest -i nextjs
After configuring performance tracing, I started exploring the traces generated by the application.
One of the useful things about Sentry is its automatic instrumentation. Depending on the supported integrations, it can capture HTTP requests, Next.js operations, database queries and frontend performance activity without manually instrumenting every operation.
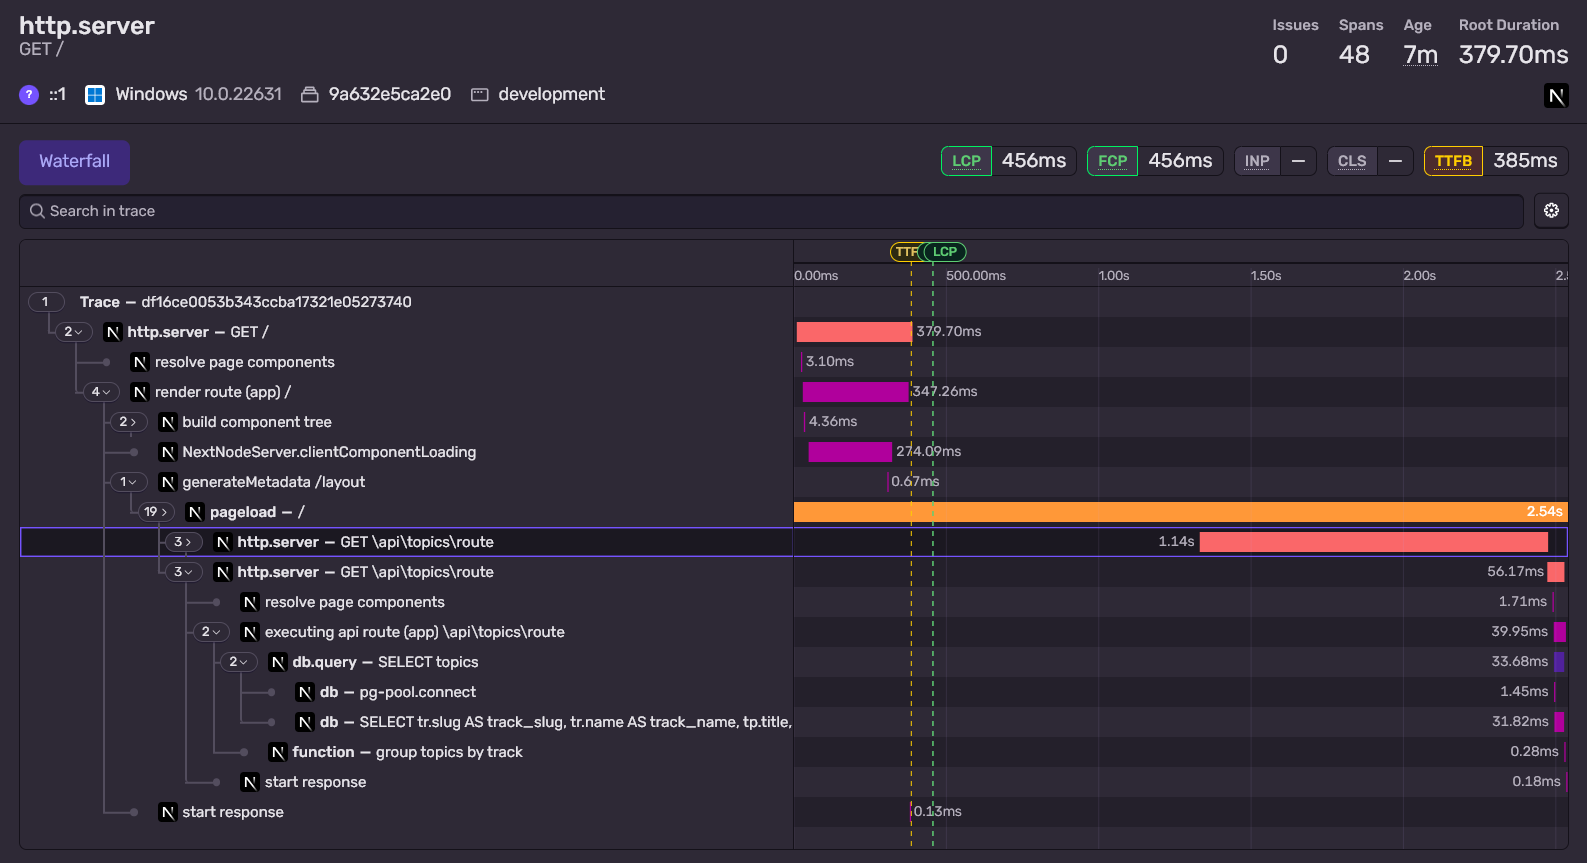
A trace captured during local development, showing the request and its associated operations.
2. Understanding trace propagation
A trace represents the journey of an operation through an application. Individual operations are represented by spans, which are connected through parent-child relationships.
Sentry uses two important headers to propagate trace context:
sentry-tracecarries the trace ID, current span ID and sampling decision.baggagecarries additional context, including dynamic sampling information.
When another instrumented service receives this context, it can continue the existing trace.
One interesting challenge I explored was the transition between server-side rendering and browser-side execution.
During initial navigation, browser JavaScript hasn't executed yet, so the browser SDK cannot attach tracing headers to the original document request.
I implemented a server-to-browser context handoff using HTML metadata:
<meta name="sentry-trace" content="..." />
<meta name="baggage" content="..." />
The server renders the trace context into the HTML response, allowing the browser SDK to continue the trace after the page loads.
I also explored custom spans for application-specific operations. Automatic instrumentation captures supported framework operations, while custom spans let us add context around logic that the framework cannot understand automatically.
3. Turning errors into actionable notifications with Discord
Observability is useful when we can actually act on what it tells us.
I configured a Discord integration for Sentry so that application errors could generate notifications in a Discord channel.
This gave me a simple feedback loop during local testing: trigger an error in the application, have Sentry capture it, and receive the notification in Discord.
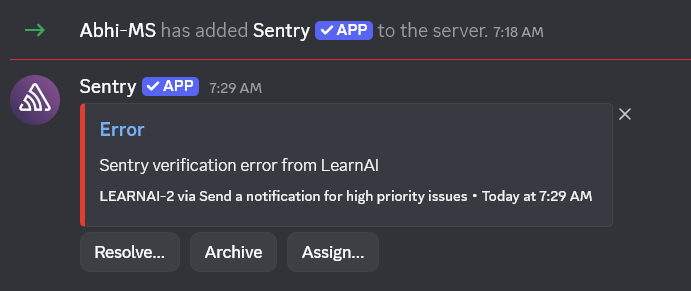
An application error captured by Sentry and delivered to Discord during local testing.
This is a useful example of connecting error monitoring to a communication channel where developers can see and respond to issues.
4. Sentry's built-in dashboards
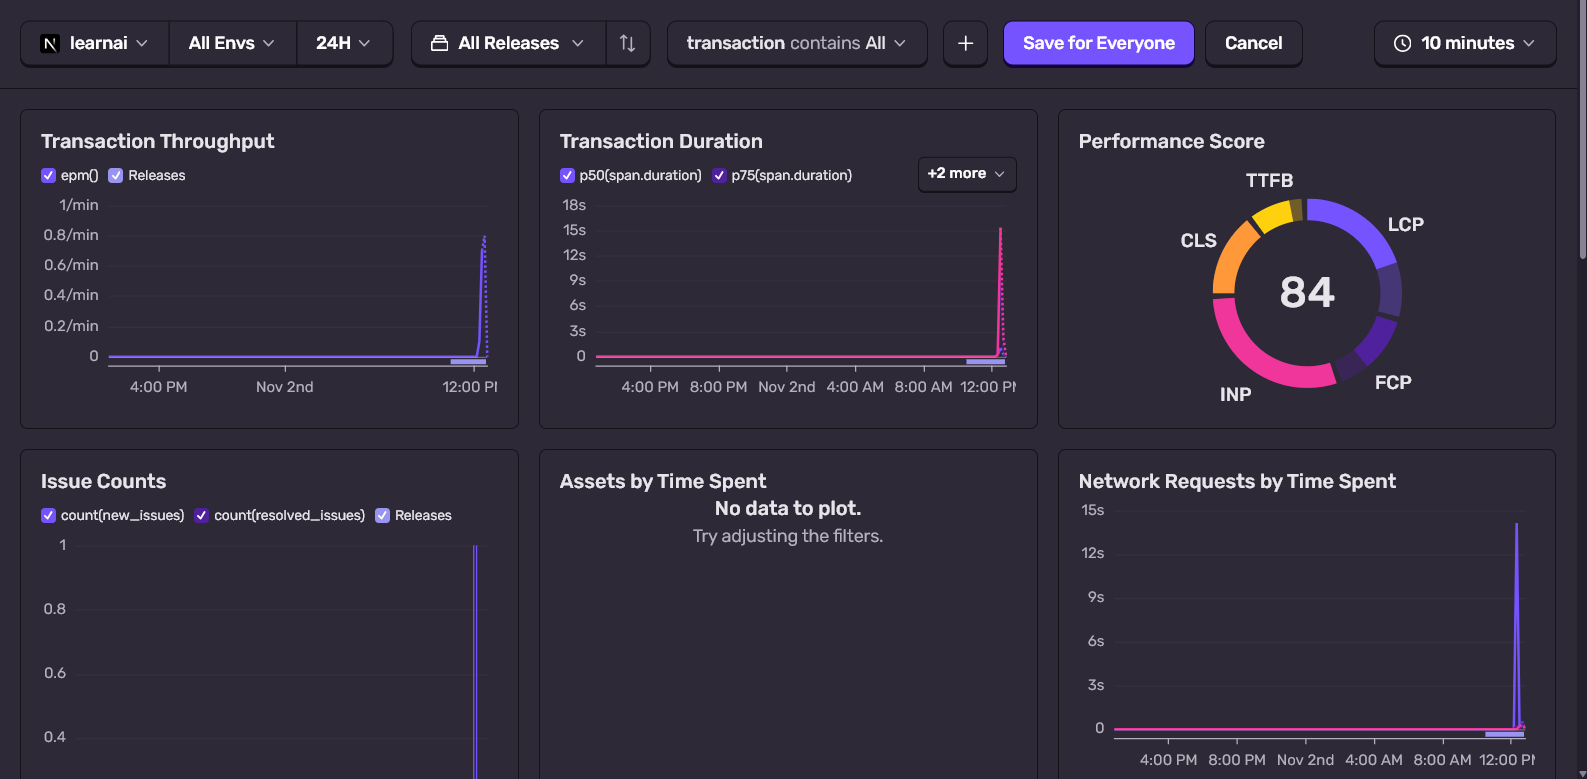
Another feature I explored was Sentry's built-in dashboards.
The dashboards I looked at included:
- Backend Overview
- Frontend Overview
- Web Vitals
- Queries / Query Details
- Outbound API Requests
These provide a higher-level view of application behaviour before drilling into individual traces.
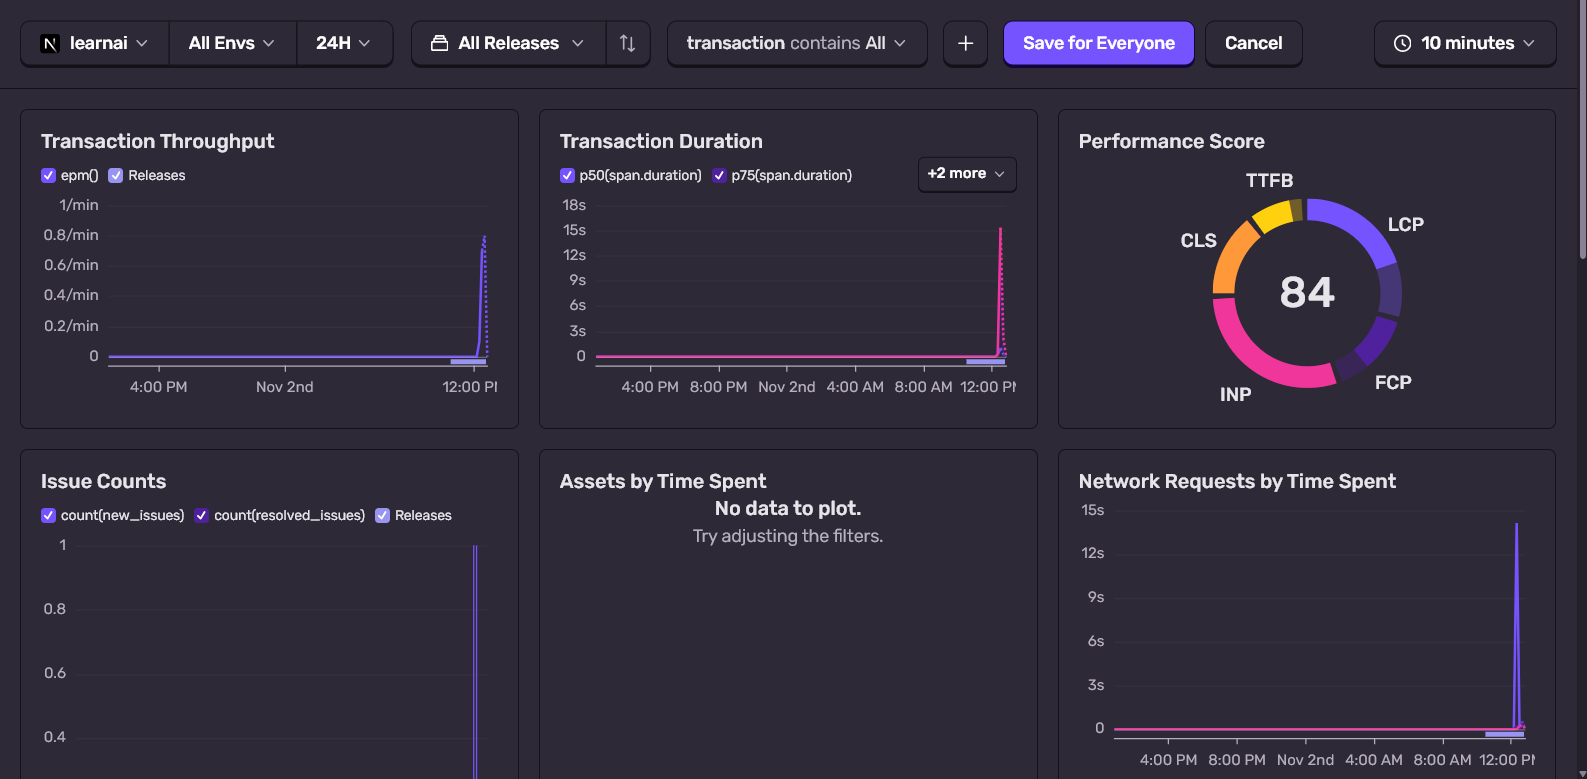
Sentry's built-in dashboards for investigating application performance and behaviour.
The workflow becomes quite natural: identify an issue through a dashboard, open the relevant trace, inspect the span hierarchy and investigate the operation responsible.
5. Where AI observability gets interesting
This is the part of Sentry's direction that I find particularly relevant.
AI-powered applications introduce more than ordinary API calls. They involve model execution, tool calls, agent workflows and interactions with external systems.
With supported integrations, Sentry can capture AI-related operations and connect them to the wider application trace. Depending on the integration, this can provide visibility into model calls, tool execution, latency, token usage and errors.
Sentry also provides MCP monitoring and Seer, its AI-powered debugging capability.
I experimented with another part of this ecosystem: retrieving trace data through Sentry's API and using a local AI agent to investigate runtime behaviour.
The idea is interesting because an AI coding agent doesn't have to reason only from source code and a developer's description of a problem. It can also work with telemetry showing what actually happened at runtime.
Source code describes what we intended the application to do. Telemetry provides evidence of what it actually did.
6. Final thoughts
AI-assisted development doesn't end when an agent generates code. We also need reliable ways to observe, understand and debug that code when it runs.
As more companies integrate AI into their applications, observability needs to evolve alongside it.
That's what I find interesting about Sentry: it brings application monitoring, distributed tracing, AI observability and AI-assisted debugging closer together.
My exploration started with distributed tracing in a Next.js application, but it gave me a broader appreciation for the infrastructure needed to build and maintain AI-powered systems.
AI makes it easier to build. Observability helps us understand what we've built.
Resources
About the author
A self-taught software engineer passionate about modern web development. I write about my learning journey, projects, and GSoC experiences using Next.js, React, Tailwind CSS, and GraphQL.
Comments
Join the discussionNo comments yet. Be the first to comment.

